
%207.svg)

.svg)

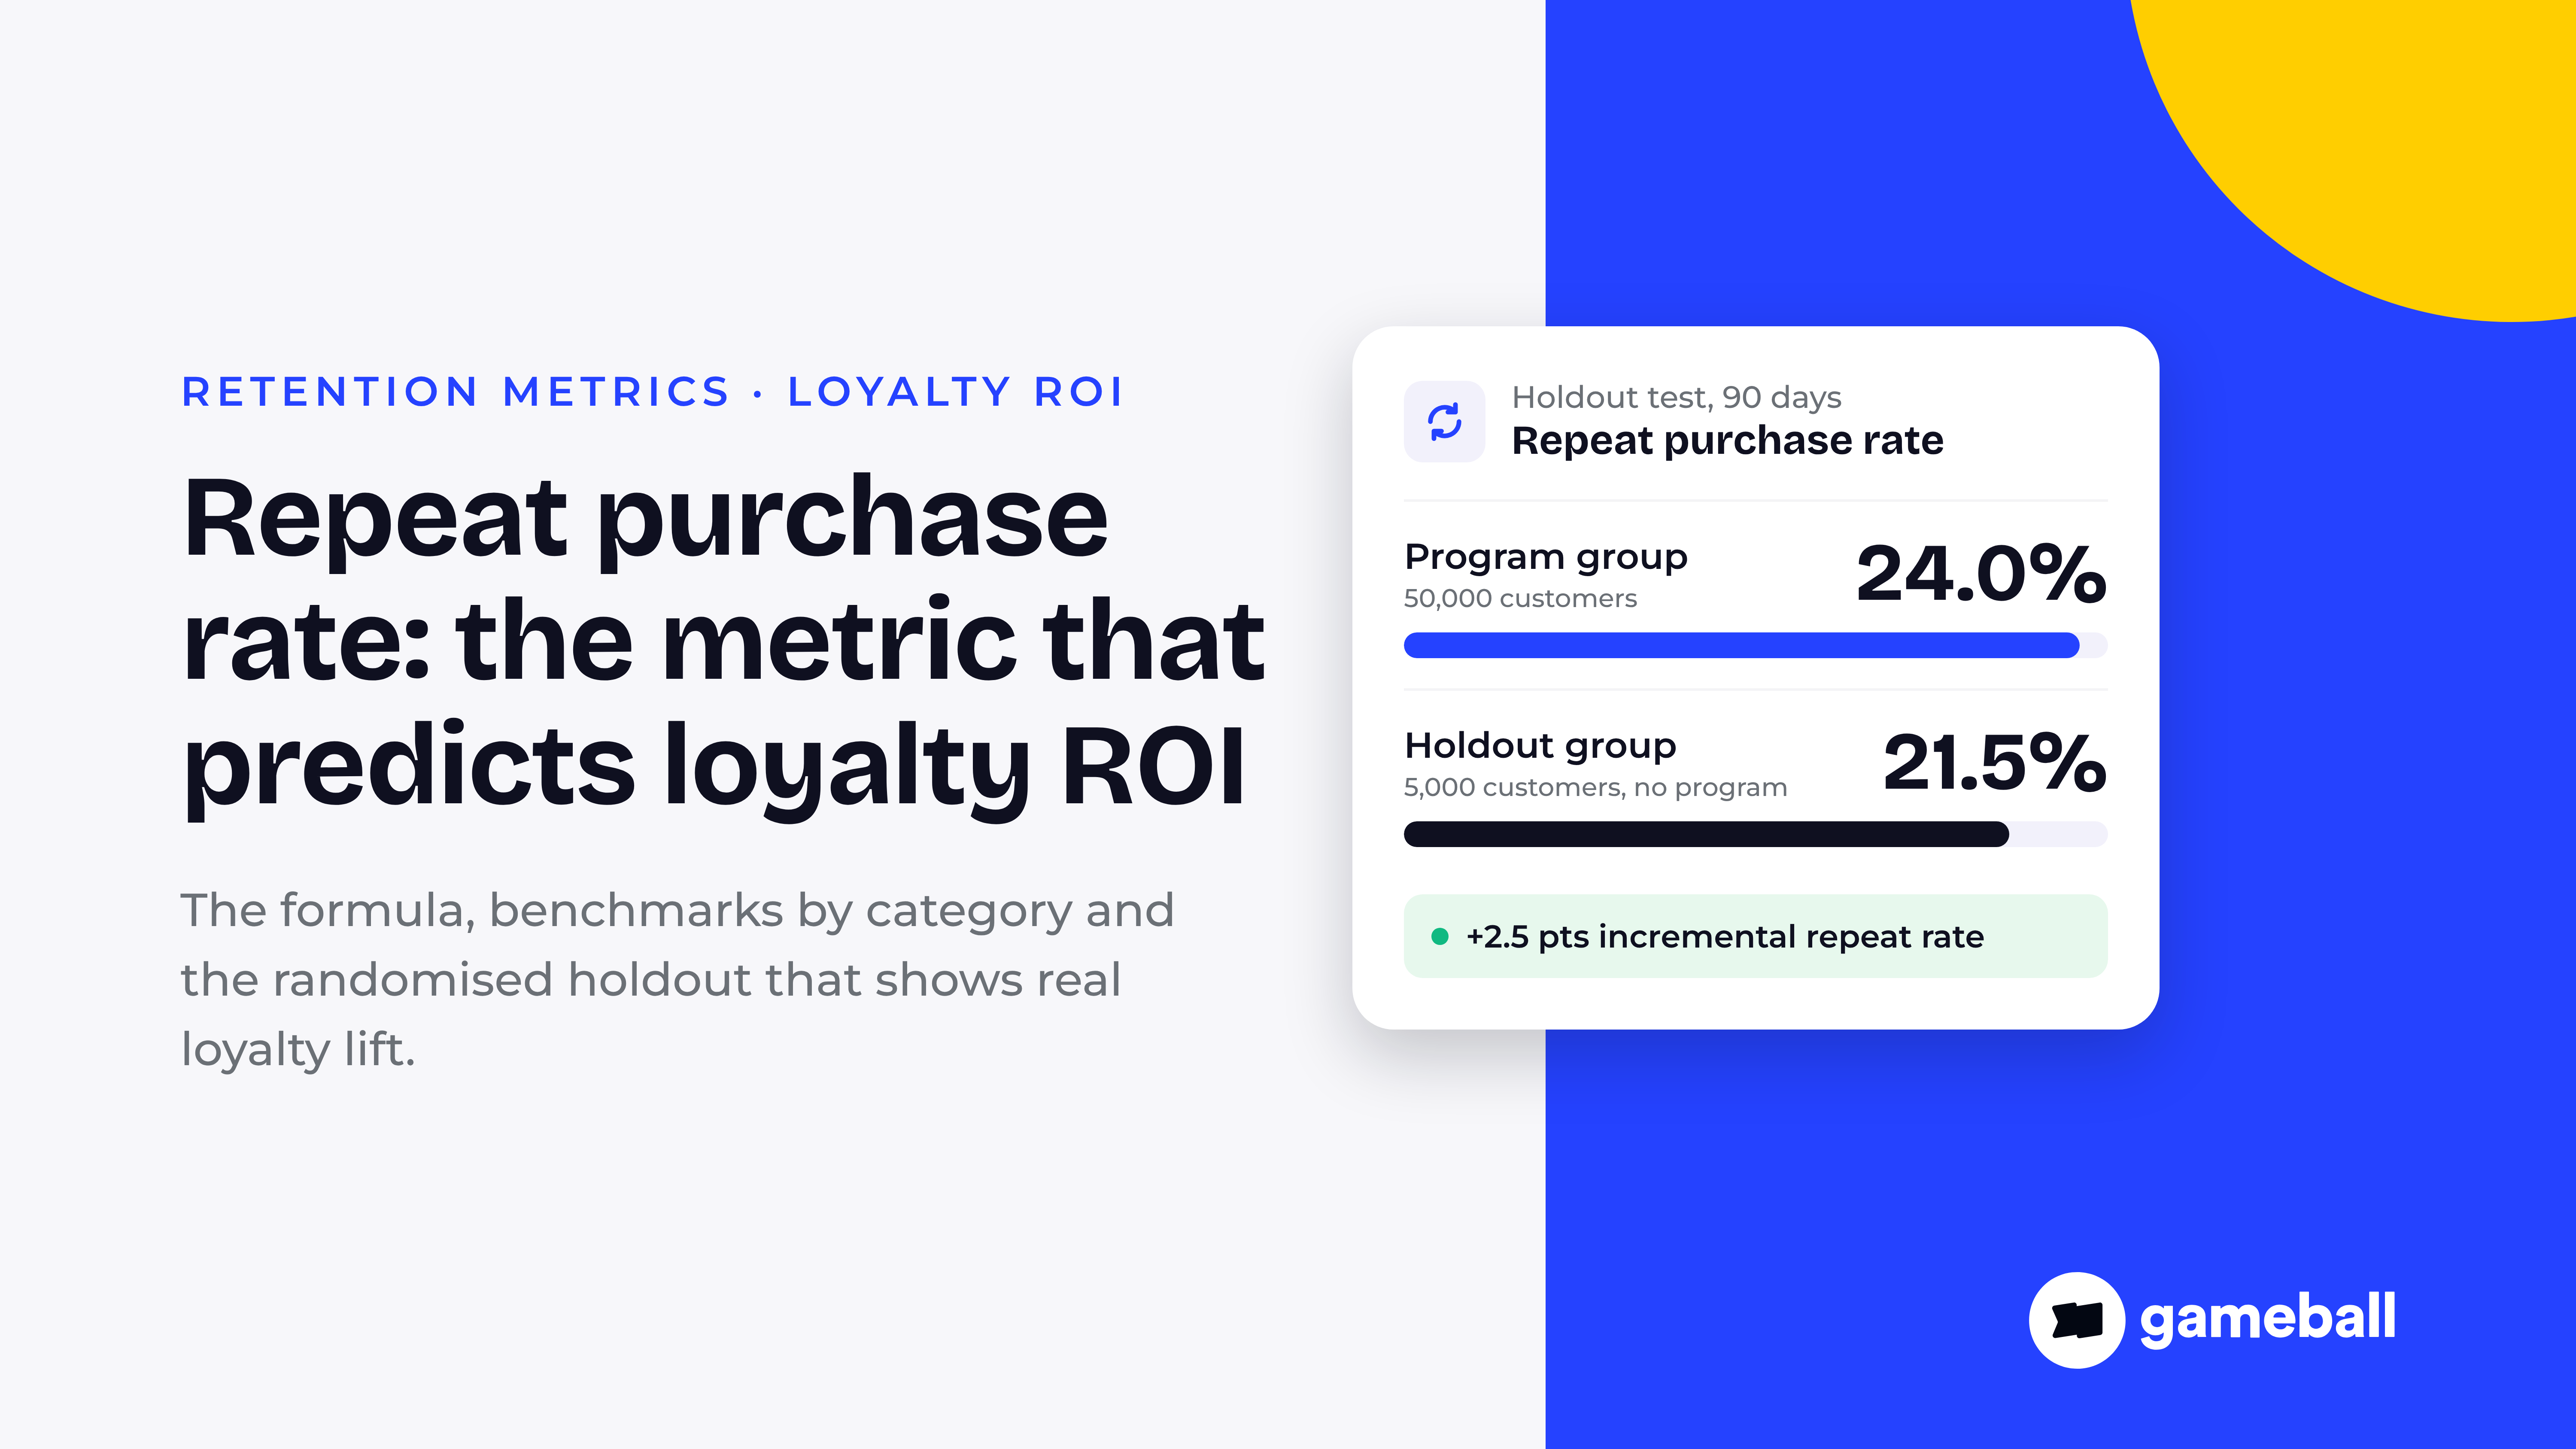
Repeat purchase rate is the share of your customers who placed more than one order in a set period, calculated as repeat customers divided by total customers, times 100. It is the earliest reliable signal that a loyalty program is working, and also the easiest number in ecommerce to misread.
This guide covers the formula, a worked example, published benchmarks by category, how the metric differs from repeat customer rate and purchase frequency, and the part most articles skip: how to separate the repeat rate your program actually caused from the repeat rate that would have happened anyway, using a randomised holdout.

What is repeat purchase rate?
Repeat purchase rate measures how many of your customers came back to buy again within a defined window. A customer who ordered twice or more counts as a repeat customer; a customer who ordered once does not. It sits at the centre of any retention strategy, and to see how it fits with acquisition, lifecycle and win-back work, read our companion guide on building a retention-first growth engine.
The catch is that the same name gets used for different formulas. Polar Analytics ran one store's quarter through three of them: 1,000 customers, 220 of whom ordered again, across 1,600 total orders. The customer level formula gives 22%. Repeat orders as a share of all orders gives 38%. Orders placed by repeat buyers as a share of all orders gives 51%. Same data, three answers.
Here is that spread side by side, using Polar's worked example.
This guide uses the customer level formula throughout, because it is the version Klaviyo and most ecommerce platforms report and the one that maps cleanly onto a holdout test later on.
How to calculate repeat purchase rate
To calculate repeat purchase rate, count the unique customers who placed two or more qualifying orders in your window, divide by all unique customers who ordered in that window, and multiply by 100. The arithmetic is trivial. The decisions around it are where most dashboards go wrong.
For a fast growing store, also run the cohort version: of the customers whose first order landed in January, what share placed a second order within 90 days? Blended rates fall as a store grows simply because the mix tilts toward new customers who have not had time to reorder. Cohorts remove that distortion, and pairing them with RFM customer segmentation shows which segments are actually coming back.
Why repeat purchase rate matters for loyalty ROI
Repeat purchase rate matters because it is the leading indicator of customer lifetime value, and lifetime value is what pays back every acquisition dollar. When more first time buyers return, purchase frequency rises, and so does customer lifetime value, long before the full revenue shows up in a quarterly report.
The research on retention economics is old but consistent:
Both Harvard Business Review figures come from Amy Gallo's piece on the value of keeping the right customers. That is why repeat rate is the number most loyalty program ROI calculations lean on. It is also why it deserves more scrutiny than it usually gets, which is the subject of the next few sections.
Repeat purchase rate benchmarks by category
A good repeat purchase rate for most ecommerce stores is around 20% to 30%, according to Klaviyo, with consumables at the top of the range and high ticket goods at the bottom. Published category bands vary widely between sources, as the table shows.
| Source | Scope | Repeat purchase rate benchmark |
|---|---|---|
| Klaviyo | General ecommerce guidance | Typically around 20% to 30% |
| BS&Co (156,110 customers, 365 day window) | Multi brand DTC average | 18.8%, range 7.1% to 44.2% |
| BS&Co | Consumables | About 22% to 44% |
| BS&Co | Fashion | 10% to 17% |
| BS&Co | Durables and general retail | 7% to 18% |
| Yotpo (as compiled by Polar Analytics) | Consumables, food and beverage, cosmetics | 30% to 40% |
| Yotpo (as compiled by Polar Analytics) | Fashion and apparel | 25% to 35% |
| Yotpo (as compiled by Polar Analytics) | Electronics and high ticket items | 10% to 20% |
Notice that fashion lands at 10% to 17% in the BS&Co dataset and 25% to 35% in Yotpo's bands. Neither is wrong. They almost certainly use different windows and denominators, and Polar points out that most published figures state neither. Use external benchmarks to sanity check the order of magnitude, then benchmark against your own trailing twelve months.
Repeat purchase rate vs repeat customer rate vs purchase frequency
Repeat purchase rate and repeat customer rate usually mean the same thing, the share of customers who ordered more than once, while purchase frequency measures how many orders the average customer places. The table below separates the metrics that get confused most often.
| Metric | Formula | Question it answers |
|---|---|---|
| Repeat purchase rate | Customers with 2+ orders ÷ total customers | Did customers come back at all? |
| Repeat customer rate | Usually identical to the above; some tools use orders from returning customers ÷ total orders | Check which version your platform reports |
| Purchase frequency | Total orders ÷ unique customers | How often does the average customer buy? |
| Customer retention rate | (Customers at end of period minus new customers) ÷ customers at start | How many existing customers did we keep? |
| Churn rate | Customers lost ÷ customers at start of period | How many existing customers did we lose? |
Repeat purchase rate and churn are two views of the same behaviour, so track them together. Our guide to calculating and reducing customer churn rate covers the churn side in depth.
Why loyalty program repeat rates look better than they are
Loyalty program repeat rates look better than they are because the customers who join a program were already more likely to come back. Compare members with non members and you measure that head start, not the program.
This is self selection, and it shows up in some of the most quoted loyalty research. McKinsey's analysis of loyalty programs reports a striking spending gap between members who engage and members who do not:
That finding, from McKinsey's eight levers report, is real, and it is a useful description of who your best customers are. What it cannot tell you is how much of the gap the program created. A customer who loves your brand enrolls, redeems and spends more; she might have spent most of that anyway.
The same trap applies to repeat purchase rate. Members will almost always show a higher repeat rate than non members. The honest question is how much higher it is than it would have been without the program, and only a controlled comparison answers it.

Very few brands run that comparison. An Incentivio analysis of restaurant loyalty measurement reports that 30% of brands do no control group testing at all, 60% rely only on campaign specific holdouts, and just 10% use a global holdout that can answer whether the program as a whole causes the lift.
How to measure incremental repeat purchase rate with a randomised holdout
To measure the repeat purchase rate your program actually causes, randomly assign a small share of eligible customers to a holdout group that does not get the program, then compare the repeat rate of the two groups over the same window. The difference is your incremental repeat rate.
Randomisation is the whole trick. Because a coin flip decides who is held out, both groups contain the same mix of fans, bargain hunters and one time buyers, and the only systematic difference between them is the program.
- ✕Members chose to join, so they were already more engaged
- ✕Seasonality and promotions hit both groups differently
- ✕Overstates lift, sometimes by a wide margin
- ✓Easy to pull from any dashboard
- ✓A random draw decides who gets the program
- ✓Both groups face the same season, prices and promotions
- ✓The gap between groups is causal lift
- ✕Needs planning, a clean list and enough customers
A practical setup, following the global holdout approach Incentivio recommends (5% to 10% of eligible customers for a 90 day window), looks like this:
Measure everyone who was assigned to each group, not only those who enrolled. Comparing enrolled treatment customers with the whole holdout brings self selection straight back in. Running both groups through the same window also matters in the GCC, where Ramadan, White Friday and national day campaigns can swing repeat rates on their own.

Here is how the math works on an illustrative store. The numbers are hypothetical, chosen to show the calculation.
| Line | Treatment group | Holdout group |
|---|---|---|
| Customers assigned | 50,000 | 5,000 |
| Customers with 2+ orders in 90 days | 12,000 | 1,075 |
| Repeat purchase rate | 24.0% | 21.5% |
| Incremental repeat rate | 2.5 percentage points | Baseline |
| Incremental repeat customers | 2.5% × 50,000 = 1,250 | Not applicable |
The naive view on the same store might have shown members at 39.5% against 21.5% for non members, an 18 point gap. The holdout says 2.5 points is what the program earned. That smaller number is the one to put in front of a CFO, because it survives scrutiny. Multiply the 1,250 incremental repeat customers by the margin on their extra orders, subtract rewards and platform cost, and you have a defensible measure of loyalty program success.
Check that the lift is larger than the noise. With a 5,000 customer holdout and repeat rates near 20%, the 95% confidence interval on the difference is roughly plus or minus 1.2 percentage points, so a 2.5 point lift is clearly real. Smaller stores should use a larger holdout share or a longer window.
How to increase repeat purchase rate
The fastest way to increase repeat purchase rate is to win the second order, because the jump from one purchase to two is where most customers drop away. Every tactic below should be read against your holdout, not against last quarter.
- Repeat purchase rate is customers with two or more orders divided by total customers, times 100, always reported with its window.
- Three formulas share the name; on one store the results ranged from 22% to 51%.
- Published benchmarks cluster around 20% to 30% overall, with consumables highest and high ticket goods lowest.
- Member versus non member comparisons overstate loyalty lift because engaged customers self select into programs.
- A randomised holdout of 5% to 10% of eligible customers isolates the repeat rate your program actually causes.
How Gameball helps
Gameball combines a points and tiers loyalty program, gamified campaigns and referrals with automation triggers that move customers from their first order to their second. Gameball's analytics track repeat purchase rate, CLTV and RFM segments and sync to your data warehouse, so you can read a holdout test in your own BI tool; book a demo or see pricing to get started.
Related reads
- Customer Churn Rate: How to Calculate It and 12 Ways to Reduce It
- Retention Marketing: How to Build a Retention-First Growth Engine
- How To Calculate Your Loyalty Program ROI
Frequently asked questions
What is a good repeat purchase rate?
A good repeat purchase rate for most ecommerce stores is around 20% to 30%, according to Klaviyo. Consumables such as beauty, coffee and grocery usually sit higher, while electronics and other high ticket goods often sit between 10% and 20%. Compare against your own trailing twelve months first, since published benchmarks rarely state their window.
How do you calculate repeat purchase rate?
Divide the number of customers who placed two or more orders in a period by the total number of customers who ordered in that period, then multiply by 100. For example, 220 repeat customers out of 1,000 total customers gives a 22% repeat purchase rate. Always report the time window alongside the number.
Is repeat purchase rate the same as repeat customer rate?
Usually, yes. Both terms most often mean the share of customers who ordered more than once. Some analytics tools, however, label the share of orders placed by returning customers as repeat customer rate, which produces a much higher number. Check your platform's definition before comparing figures across tools or against published benchmarks.
What is the difference between repeat purchase rate and purchase frequency?
Repeat purchase rate tells you what share of customers bought more than once. Purchase frequency tells you how many orders the average customer placed, calculated as total orders divided by unique customers. A store can have a modest repeat rate but high purchase frequency if a small group of loyal customers orders very often.
How do you know if a loyalty program increased repeat purchase rate?
Run a randomised holdout. Before launch, randomly hold back 5% to 10% of eligible customers from the program, then compare repeat purchase rate between the two groups over the same window, such as 90 days. The difference is the incremental lift the program caused, free of self selection and seasonality.
What time window should I use for repeat purchase rate?
Twelve months is the most common window because it smooths out seasonality and suits most ecommerce categories. Fast replenishment categories such as coffee, pet food or skincare can use 90 days. For growing stores, add a cohort view, such as the share of January first time buyers who reordered within 90 days.
.svg)
.svg)
.svg)

Ready to level up your game?
Create your first campaign and start seeing results in 30 days.
Ready to grow?
Get in touch with our sales team today.
The loyalty vendor checklist your CTO
will thank you for
Discover engineering challenges, essentials, and more from global brands.

Gameball Staff
Stay ahead on retention
Subscribe to our newsletter and get all the latest updates as we post.

Ready to level up your game?
Create your first campaign and start seeing results in 30 days.
Read related articles


_compressed%2520(1)%2520(1).avif)
Ready to level up your customer loyalty?
Level up your customer loyalty!


.avif)
.avif)
.avif)
.avif)